You can import the blocks presented here as a project or download them as a library to import into your projects.
This chapter of the guide relies upon a library for machine learning that are known to run well in the Chrome or Edge browser. See the troubleshooting guide for how to deal with problems encountered.
In previous chapters you used blocks that relied upon pre-trained machine learning models. In some cases, using transfer learning you were able to extend the models a little. In this chapter we introduce blocks that enable you to create deep machine learning models from scratch, train them, and use their predictions in your projects.
One can build models that learn about real-world data such as weather, traffic, astronomy, economics, politics, and any of the many other open data sources. You can build models that will try to guess the next number in a sequence.
Neural nets can only process numeric data. This isn't a great limitation however since we provide blocks that convert text, images, and sounds into numbers:
As we explore later in this chapter one can create intelligent game playing programs using these machine learning blocks. The trick is to turn game boards/positions into a list of numbers and the game outcome into a number so the model can be trained on records of previous games.
To create and use a machine learning model you need to:
In the following you can use the Create a neural net model ... block to create a model with two "hidden" layers of size 100 and 20. (Hidden here means that they are in-between the input and the output.) You can then use the Send training data ... block to set the training data to ten numbers and their square roots. Next you can use the Train model named ... block to train the model. This can take several seconds and you should finally see the remaining "error" (often called the "loss"), the accuracy, and how long it took. Smaller errors are better. Finally, you can use the Get predictions from model ... block (the version that gets many predictions at a time) to test how well the model has learned.
You will notice that it is hard to train the model to compute square root estimates very well. There are full-featured versions of blocks for creating and training models that enable you to alter more parameters. We suggest you first experiment with what are called the hyperparameters such as the number and size of the layers, the optimizer, the learning rate, the loss function, the validation split, and the number of learning steps. With the right settings the following can create a good square root estimator.
Note that the training can take several minutes. So long as you leave the tab visible you can do other things on your computer while it is running. We advise putting the tab in a new window. Once a model is trained and you are ready to use it in your app you can save the trained model and load it into your app to avoid the training time.
By changing the input and output lists you can make a model that computes different functions. For example, you could train a model to convert from Centigrade to Fahrenheit. Try a few functions and see if some are easier to train than others.
The machine learning blocks are not restricted to learning how to map one input number to an output number. A simple example is a model that estimates the distance a point is from the origin. Given values for x and y it estimates the square root of the sum of the squares of each.
You can train a model to put a label on data. For example, here is a model trained to provide a name for a color. It was trained to output a label for a vector of three numbers: hue, saturation, and brightness. 50 different random colors were given one of nine color names. Instead of responding with a number or a color name the model lists a "score" for each of the possible color names. The scores add up to 1. The confidence or probability of being correct of each label is turned into percentages by multiplying each score by 100. The following model does well with only a few colors, perhaps you can improve by training it with more colors and by training it better.
Neural nets only work with numbers so how do outputs such "red" and "green" work? Click to learn how.
The Snap! blocks for machine learning check if the output values are numbers. When they aren't, it collects together all the unique values (e.g., all the color names in the data). It then uses a technique called one hot. If the colors were "red", "green", and "blue" they could be converted to 0, 1, and 2. But it wouldn't work well since the numbers imply that "red" is closer to "green" than "blue". Even if you think that is OK what about when one adds "white" or "black" to the list? With one hot, red can be <1, 0, 0>, green <0, 1, 0> and blue <0, 0, 1>. Each color is equally distant to any other this way.
The model responds with predictions with a vector of numbers between 0 and 1 that add up to 1. Each number is what the model estimates is the probability that the correct color name is the corresponding one in the list of color names. E.g. For if the prediction is <0.5, 0.2, 0.3> for "red", "green", and "blue" then the model is estimating that the odds of red being correct is 50%, green 20%, and blue 30%. The Snap! model prediction blocks return a list where each element is a list of a color name and number. The Name this color ... in the above sample project sorts the list by the probability scores and multiplies by 100 to convert to percentages.
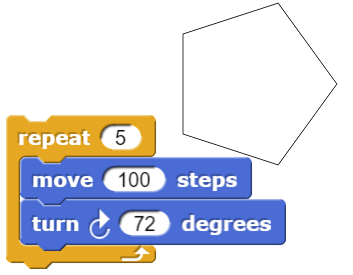
One way to draw a polygon is to repeatedly go forward and turn. E.g. a pentagon is

If we add a little "noise" to the amount that the sprite goes forward or turns we get a bit more interesting result.
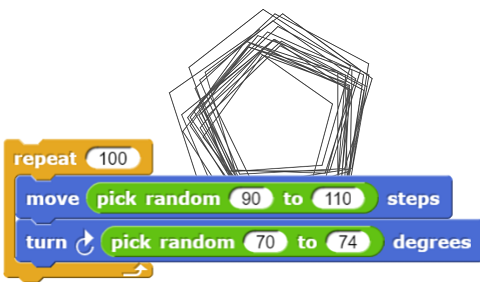
If we change the pen colour and size each time we can get some very pretty results. And some very ugly ones.
Maybe we can train a neural network to rate how nice noisy polygons look.
In the following after giving some random noisy polygons ratings you can train it to predict ratings.
Each noisy polygon is defined by just 12 numbers:
minimum step, maximum step, minimum turn, maximum turn, minimum red, maximum red, minimum green, maximum green, minimum blue, maximum blue,
minimum pen size, and maximum pen size.
The neural net will be trained with a collection of these 12 numbers as input and rating numbers as output.
One way to build a question-answering app is to use a table of expected questions and known answers.
To deal with the many ways to ask the same question one can train a model using
the features of sentence block described in
the
chapter on word and sentence embeddings.
An app can respond to questions by choosing the top-scoring predictions from the model given the embedding of the question.
Here is a project for defining, training, and testing such as app:
Using the features of sentence block together with a few training examples we can create an app that will indicate the degree of confidence (or lack thereof) indicated by the input sentence. Here is a project for defining, training, and testing such as app:
Here is simple project that uses this model.
A deep neural net consists of an input layer, some number of hidden layers, and an output layer. The nets that the Create a neural net model ... block creates are always in a sequence and each neuron is connected to every neuron in the neighboring layers. While this is a common architecture, there are many models that connect the neurons in other patterns. Some contain branches and loops and some are connected more sparsely.
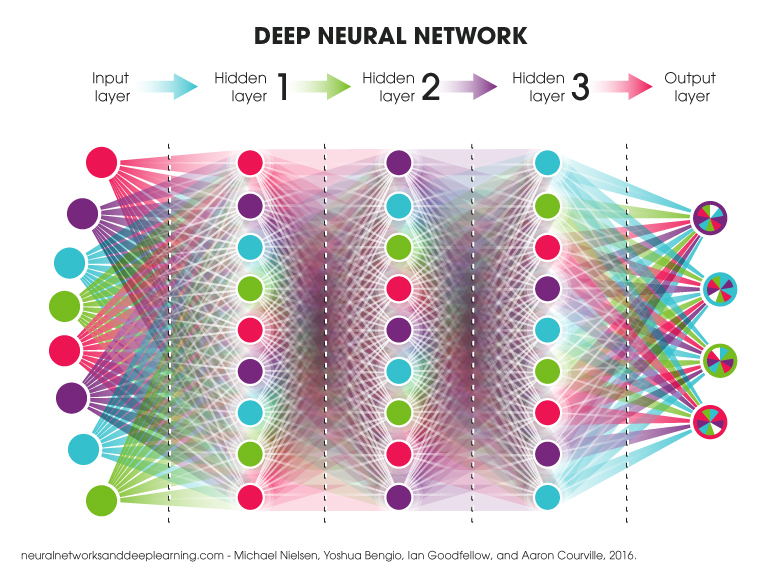

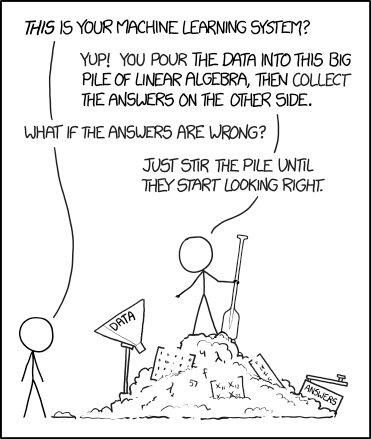
When predicting each neuron adds up all of its inputs from the previous layer after multiplying each input by a weight. Instead of sending the sum out to the neurons of the next layer it first checks if the value is negative and then sends zero instead. (This is a popular operation on the sum but some neural net models do other mathematical operations instead.) It is the weights (sometimes called "parameters") that are "learned" during training. They do this using a mathematical technique called gradient descent. It repeatedly takes small steps to reduce the "loss" or "error". There are different strategies for doing this efficiently that are called optimizers. The size of the step taken each time is called the "learning rate". If the learning rate is too small progress is very slow. If it is too large then the error may bounce up and down rather than making progress towards a lower value.
The get layer of model block can be used to obtain the parameter values for any layer of a model. Also, the open support panel tensorflow.js block can open up the model interface page which has a section called "Model after creation" or "Model after loading". In that section one can obtain statistics about each layer.
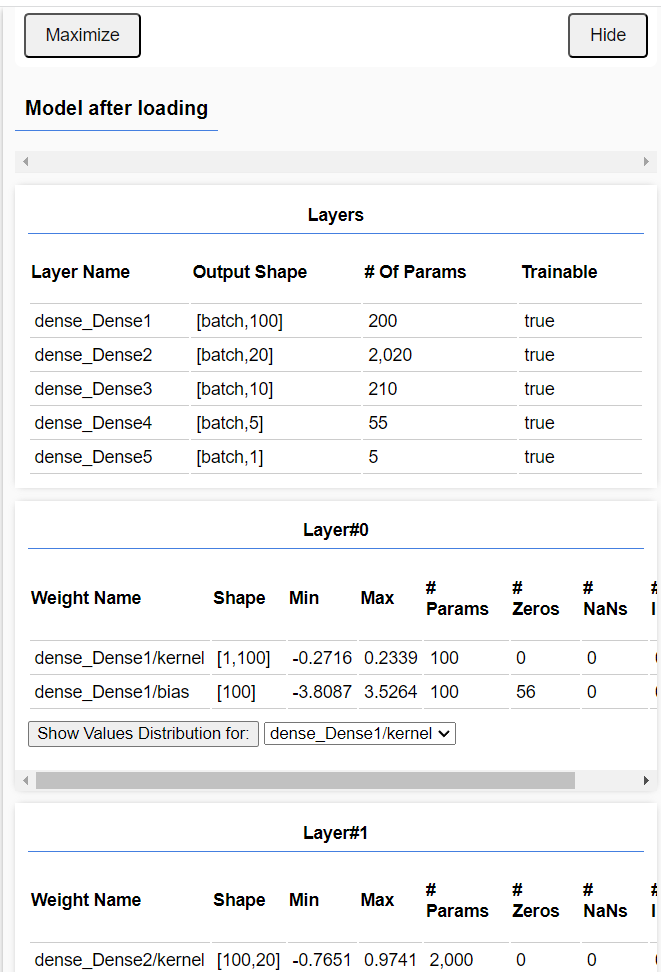
Models and data can be saved and loaded using the 'Saving and loading' button which can be found by clicking the open support panel tensorflow.js block to open an interface page and navigating to the Save/Load section. Your projects can load models using the Load neural net from URL ... block if you have copied your saved model files (both the JSON that defines the model and the learned weights file) to a web server.
Other blocks can load data using the Load X data from URL block where X can be either "training" or "validation". Training data is used in training both as data to process and a random sample is used to calculate how well the model is doing. Validation data is used to calculate the error or loss during training. The validation data error can be used to tune the learning process.
Every day there is news of new applications of machine learning to problems. Sometimes it is for entertainment as when SnapChat filters add animations or distort people's faces. Sometimes it saves lives as when students used machine learning to predict wildfires. Or to generate art that sells for a high price or to help Japanese cucumber farmers sort their cucumbers. Machine learning is increasingly used to help scientists, for example, to find exoplanets.
You can bring data into Snap! and use it to train your models. You can find available data by doing a web search but often even better is to use Google dataset search. In the following we found two datasets to explore whether weather data can help predict incidence of influenza (you may wish to explore covid and weather instead). For a collection of daily weather records for hundreds of places worldwide, some going back more than one hundred years, we used this weather data (documented in the readme.txt file). And for the number of cases of flu each week across many countries we used Epi Data Surveillance Information from the World Health Organization.
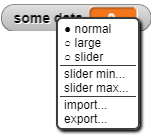
An easy way to bring data into Snap! is by dragging a file onto the Snap! browser tab. This works for TXT, CSV (a spreadsheet format), and JSON (JavaScript structured data) file types. Or if you already have a variable, you can import its contents by right clicking on the variable's "watcher" and select import.
Another way to bring data into Snap! is via the url reporter. Many data sources provide URL-oriented interfaces that report JSON or CSV data. The split reporter can interpret JSON and CSV texts into data structures implemented as lists of lists of lists of ...
Bringing data into Snap! via a URL (or more generally using the GET and POST methods in Snap!'s Web Services Access library) has the advantage of providing the most up-to-date data to your apps. It also makes your projects much smaller since the project doesn't need to have variables holding the data. But it is only practical when users have fast and reliable Internet connections.
Bringing data into Snap! as text is sometimes only the first step. If you import some text and need lists, you can use the Snap! split ... by block to turn text into lists. Data often needs to be cleaned up and restructured. This is often called data wrangling.
In this Snap! project data wrangling is performed on both the weather and flu data. The idea is to have each element of the weather dataset to contain the weather for a week matched up with the flu data for the following week. (If one week is not a good estimate for the duration between exposure and confirmed diagnosis, then one can try other offsets.) One problem is that the flu data from the World Health Organisation is weekly for entire countries while the weather data is daily for weather stations (often in cities). In the sample project data for Ireland and Switzerland were used because a big country could have very different weather in different parts. Also one needs to avoid datasets that are incomplete which occur often.
Weather and flu are seasonal so to make interesting predictions we need to determine whether the weather data having been higher or lower than typical for that time of year predicts how the flu cases will vary from what is typical for that time of year. To address this, an earlier version of the sample project changed all the data by dividing by the average values. This worked fine for the flu data since the data is always non-negative. The flu data is capturing the multiplicative factor to which the case numbers were above or below average. This did not, however, work for the temperature data since the values can be negative. The mean temperature can even be zero which cannot be used as a divisor. Furthermore, some of the values were large enough that sometimes early in training the loss became NaN (not a number). This stops the training due to some internal model parameters becoming too big or small. The new version of the project uses the normalize block to instead map all the temperatures by subtracting by the mean and dividing by the standard deviation to normalize the data. The weather data were normalized for the averages for each month of the year. This improved the model's predictions (but they still were only a little better than predicting the average values).
Another challenge is to work out how to evaluate how well a model does. Is it good enough if the model predicts better than chance given a week's weather data whether the next week's flu reports will be above or below average? Or should we measure how far off the predictions are on test data from what the following week's flu occurrences really were?
If you want to work on the question of whether the weather partially helps predict flu cases in the following week then there are many things to try to enhance this first draft of such a project. Perhaps you can improve it with more or different data. Or by designing a different machine learning model and training scheme. Or if you start to get good predictions then see if a simpler model works almost as well. Maybe the precipitation measurements don't matter. Or maybe it doesn't need the full daily measurements of the previous week. Alternatively, try doing something similar with other available datasets. There are excellent covid datasets, for example.
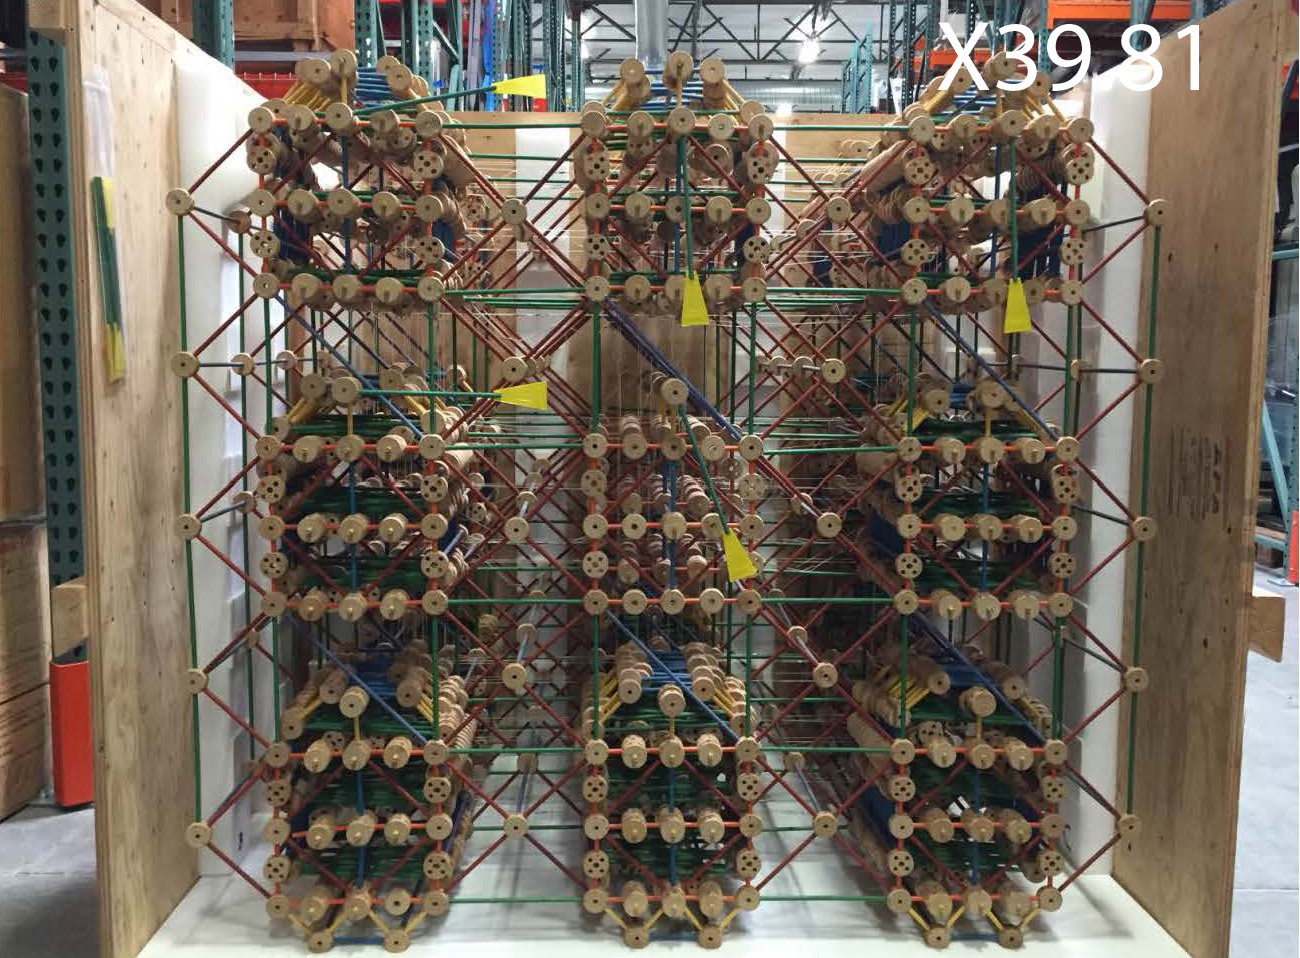
Tic Tac Toe (also known as Noughts and Crosses) is a simple game. A computer could have all 255,168 games in memory and play perfectly by searching its memory. A Tinkertoy computer made of wooden spools and sticks plays a perfect game. So does a computer made of DNA.
Donald Knuth, a world famous computer scientist, wrote a Tic Tac Toe learning program in 1958 when he was 20 years old. The computer had 10 kilobytes of memory (the laptop that I'm using to write this has more than one million times more memory). In those days computers didn't have keyboards, displays, or mice.
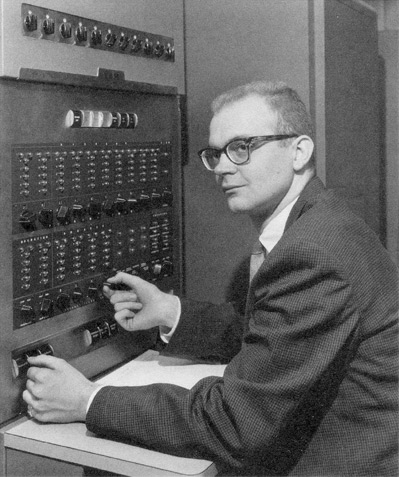
Here is a five-minute video where Donald Knuth tells stories of his Tic Tac Toe program:
Your challenge is to train a deep neural net to play well. You can start with this Snap! program for playing Tic Tac Toe and add scripts for recording games, creating neural nets, using those games for training your nets, and finally using the trained neural net models to play the game. This is quite challenging and only appropriate for those with a good deal of experience with Snap! and machine learning.
An alternative is to instead focus on learning how to design good neural nets and how to train them effectively. Click on the following to skip the Snap! Tic Tac Toe programming challenge and instead start training models right away. Once you have a model trained to win (most of the time), you can set up tournaments with the trained models of classmates or friends!
Click to see how you can train a neural net to play Tic Tac Toe in Snap!. You might want to try this on your own before reading this.
This Snap! program has a variable called Players whose value is a list of two player types. A player type can be 'human', 'random', or the name of a model you created. Games are recorded and are the basis for training. The space bar will start a new game and, if humans aren't playing, a new game will start as soon as a game is over.
There is a supporting web page that allows you to experiment with training and provides a way to save and load models and game data. Use the open support panel tensorflow.js block to open up this page. It will have a 'return to Snap!' button.
The core idea is that the board positions are recorded after each move. When a game ends then outcomes are associated with each move. If the game ended in a tie, the outcome is 0. If the move led to a win, then 1, otherwise -1. The model is trained to predict a value between -1 and 1 for board positions resulting from moves. Note that it needs to predict the outcomes of board positions, even if it never encountered the board during training.
Neural nets work only with numbers so we need to decide how a board position will be represented with numbers. A straight forward way would be to use a vector of nine numbers for each board position. 0 could mean empty, 1 X has moved there, and 2 O has. This works but not as well as the following scheme. The problem is that by mixing things of different kinds (moves and non-moves) the relationships between boards is hard to discern. For example, the difference between the upper left corner having O instead of X is 1 but so is the difference between that position being empty and having an X. And why should the difference between an empty square and an O be twice the difference between an empty square and an X? So to avoid this problem machine learning programs typically use one hot vectors that are all zeros except for a single one. So X can be <1,0,0>, O can be <0,1,0>, and empty can be <0,0,1>. While a board could then be a 9x3 (or 3x9) matrix it is easier to flatten the structure so that every board is a vector of 27 zeros and ones.
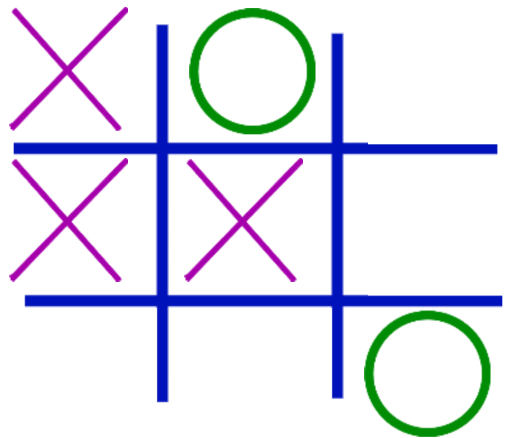
Once a model has been trained the predictions for each possible move can be computed. There are at least two ways use these predictions to make moves:
The best advice is to experiment! No one knows what is the best model architecture, the best way to generate good training data, how much training is required, etc. One way to search for a good architecture is to create two models with a different number of layers or differences in the sizes of their layers. After training them both with the same data, have them play a large number of games and see if one wins more than another. Keep the good one. (You can save models after running the open support panel tensorflow.js block.) Repeat with a different model architecture for the weaker player. Similarly, you can explore different training parameters to see which optimizer or learning rate works best. Try to discover the number of learning steps after which very little progress is made in reducing the loss so you don't waste time. One way to detect if a model benefits from additional training is to have an older version play against a newer version of the same model.
You can do all these experiments using the Snap! program but it takes several seconds to run a game. For running many large-scale experiments we provide this web page for Tic Tac Toe machine learning. It can run thousands of games in a few seconds for evaluating models or generating lots of training data. Note that you can save a model created in Snap! and then load it into the Tic Tac Toe page and vice versa.
Not all training data is equally useful. Probably the least useful is random move player against random move player. But it is easiest to generate. A human playing another human is likely to produce very good data. One way to generate lots of good data is to create a Snap! script for an expert player and use records of its games for training.
It is hard to know what parameters to use to define a neural net model and its training. How many layers? How many neurons per layer? How many training steps? How large should each training step be? Which activation and loss functions to use? What is the best optimization method?
One can run lots of experiments to find better and better answers to these questions. The answers are called "hyperparameters" because they are not the weights/parameters of the neural net but instead control how those weights are determined. Recently researchers have begun to write programs that automate this search for good hyperparameters. This is often called AutoML, short for automated machine learning. These programs can search for hyperparameters that make the best quality predictions or classifications or hyperparameters that are small and fast but still pretty accurate.
The Search for good neural net model parameters block can be used to search for hyperparameters that minimize the "loss" (make better predictions). You can control how many experiments it should run. Explore the following to see how well a model can be trained to estimate the length of the hypotenuse of a triangle.
Here are some project ideas:
Several enhancements to this chapter are being considered. There are many model architectures that cannot be expressed. Convolutional networks are very successful at handling image and sound input. Recursive neural nets handle time-based data well. Transformers are increasingly used for language models and multi-modal data. Reinforcement learning enables unsupervized learning (using only input datasets and in-world or in-simulation rewards).
This chapter provides a simplified interface to TensorFlow.js, a JavaScript implementation of Google's TensorFlow machine learning library. There is a set of tutorials for learning how to use TensorFlow.js (some familiarity with JavaScript required). Stephen Wolfram wrote a Wolfram Language textbook chapter and a blog post about machine learning for middle and high school students (some familiarity with Wolfram Language/Mathematica required). A high school student wrote this guide to learning machine learning. In this chapter we have focused on the high level "layers" part of TensorFlow.js that is closely based upon Keras (some familiarity with Python required). There are good articles about training optimizers, loss functions, and different uses of training, validation, and test data.
You can import the blocks presented here as a project or download them as a library to import into your projects.
Go to the next chapter on K Nearest Neighbors.
Return to the previous chapter on word embeddings.